The National Computer Board(NCB) of Mauritius recently announced the Open Data Mauritius portal1. It contains 100 datasets on topics such as Agriculture, Crime, Justice and Security, Health and Tourism. The portal is powered by the DKAN Open Data Platform2, which is a community-driven, free and open source open data platform that gives organizations and individuals ultimate freedom to publish and consume structured information.
DKAN includes a number of APIs3 to allow it to communicate with external applications. In this guide we are going to use the dkanr4 package, which is an R client for the DKAN REST API, to explore data on Open Data platforms powered by DKAN.
Prerequisites
- R installed on your machine
- Basic command of the R programming language. Here’s a great primer for R.
Installing necessary packages
We will use the purrr, dplyr , stringr and dkanr packages. Install them by using the following command in the console:
install.packages(c("purrr","dplyr","dkanr","stringr"))
Setup and Establish connection with data.govmu.org
First import the necessary libraries and then set up a connection without using authentication.
#use libraries
library(purrr)
library(dplyr)
library(dkanr)
library(stringr)

#setup dkanr to use data.govmu.org
dkanr_setup(url = 'https://data.govmu.org/dkan/')

#confirm connection
dkanr_settings()
The `dkanr_settings() function should output the following:
<dkanr settings>
  Base URL:  https://data.govmu.org/dkan/
  Cookie:
  Token:
Explore all datasets
After establishing connection with the open data platform, we can start explopring. First, let’s get all the datasets:
#load datasets
datasets <- list_nodes_all(filters = c(type="dataset"))

#view a snapshot
datasets
Viewing the datasets gives the following output
# A tibble: 100 x 16
   nid   vid   type   language title      uid   status created changed comment
 * <chr> <chr> <chr>  <chr>    <chr>      <chr> <chr>  <chr>   <chr>   <chr>
 1 523   1026  datas~ und      List of S~ 5     1      152445~ 152446~ 0
 2 519   1021  datas~ und      List of S~ 5     1      152445~ 152445~ 0
 3 516   1017  datas~ und      List of P~ 5     1      152445~ 152445~ 0
 4 513   1027  datas~ und      List of P~ 5     1      152436~ 152446~ 0
 5 510   1063  datas~ und      List of S~ 5     1      152436~ 152482~ 0
 6 507   1062  datas~ und      List of Y~ 5     1      152429~ 152482~ 0
 7 504   978   datas~ und      List of P~ 5     1      152429~ 152429~ 0
 8 501   969   datas~ und      Primary E~ 6     1      152422~ 152423~ 0
 9 498   967   datas~ und      "Number o~ 6     1      152422~ 152423~ 0
10 495   965   datas~ und      Number of~ 6     1      152422~ 152423~ 0
# ... with 90 more rows, and 6 more variables: promote <chr>, sticky <chr>,
#   tnid <chr>, translate <chr>, uuid <chr>, uri <chr>
We can see there are 100 entries (100 datasets) with 16 metadata fields. Use the following command to display dataset with relevant metadata:
#show attributes available
names(datasets)

#show all titles available
datasets$title
  [1] "List of Sports Federation in Mauritius"
  [2] "List of Secondary Schools in Rodrigues"
  [3] "List of Primary Schools in Rodrigues"
  [4] "List of Primary Schools in Mauritius"
  [5] "List of Secondary Schools in Mauritius"
  [6] "List of Youth Centres in Mauritius"
  [7] "List of Police Stations in Mauritius"
  [8] "Primary Enrolment and Gross Enrolment Ratio1 by sex, Island of Mauritius"
  [9] "Number of primary schools, pupils, personnel and pupil/teacher ratio, Republic of Mauritius, 1967 - 2016\t\t"
 [10] "Number of Mauritian Students Pursuing  Tertiary Education Overseas by sex"
 [11] "New Admissions on Tertiary Education Level Programmes by source"
 [12] "Gross Tertiary Enrolment Rate (GTER) in Tertiary Education by sex, 2000 - 2015"
 [13] "Enrolment of International Students in Tertiary Education locally by sex"
 [14] "Enrolment in Special Education needs in schools - Island of Mauritius, Island of Rodrigues & Republic of Mauritius, 2010 - 2016"
... truncated
Exploring a particular dataset
Once you have identified a particular dataset you are interested in exploring, you can display it’s relevant metadata. The datasets are identified by the node ID.
#find datasets which contain a particular string in title

#prints rows containing word "Education" in title
datasets %>%
     filter(str_detect(title,"Education")) %>%
     select(nid,title)
After identifying the nid, you can retrieve the metadata of the particular dataset. For instance, for the dataset “Number of Mauritian Students Pursuing Tertiary Education Overseas by sex”, the dataset nid is 495:
#retrieve metadata for the dataset
metadata <- retrieve_node(nid ='495', as = 'list')

#display all attributes available
names(metadata)
Explore a specific resource
Several resources can be associated with a particular dataset. You can list the resources available with the particular dataset, then use the resource nid to retrieve metadata of the particular resource.
#show resources associated with dataset
get_resource_nids(metadata)
#two resources are available for the dataset
[1] "496" "497"

#get resources metadata
resource <- retrieve_node(nid ='496', as = 'list')
resource2 <- retrieve_node(nid ='497', as = 'list')

#show
resource
 <DKAN Node> #496
  Type: resource
  Title: DATA-Number of Mauritian Students Pursuing  Tertiary Education Overseas by sex, 2000 - 2015
  UUID: 1df7bd18-fa9c-440c-94a6-e1087497f6ef
  Created/Modified: 1524222774 / 1524222774

resource2
<DKAN Node> #497
  Type: resource
  Title: METADATA - Number of Mauritian Students Pursuing  Tertiary Education Overseas by sex, 2000 - 2015
  UUID: b94db7c8-a487-46b4-ac98-6dff6253ff10
  Created/Modified: 1524222788 / 1524222788
Once we have the required resources, we can download the data. We are interested in resource #496, “DATA-Number of Mauritian Students Pursuing Tertiary Education Overseas by sex, 2000 - 2015”.
Data can be downloaded either using the resource url or via the DKAN Datastore API.
#check if data required is available in datastore
ds_is_available(resource)

## [1] FALSE
Unfortunately, the requested resource is not available in the DKAN datastore. We proceed by downloading the resource using the url.
#retrieve the resource url from the resource metadata
resource_url <- get_resource_url(resource)

##[1] "https://data.govmu.org/dkan//sites//default//files//DATA-Number of Mauritian Students Pursuing  Tertiary Education Overseas by sex, 2000 - 2015.csv"
The resource_url is a string and needs to be encoded to a URL. You can then use the read.csv2 function to load the data from the url.
#encode url
resource_url_encoded <- URLencode(resource_url)

# "https://data.govmu.org/dkan//sites//default//files//DATA-Number%20of%20Mauritian%20Students%20Pursuing%20%20Tertiary%20Education%20Overseas%20by%20sex,%202000%20-%202015.csv"

#load data
resource_data <- read.csv2(resource_url_encoded,sep=',',header = TRUE)

#show first 10 rows
head(resource_data,10)
Play with data
After downloading the data, you can start exploring it.
mean(resource_data$Number.of.Mauritian.Students.Pursuing.Tertiary.Education..Overseas.Male)

max(resource_data$Number.of.Mauritian.Students.Pursuing.Tertiary.Education..Overseas.Total)
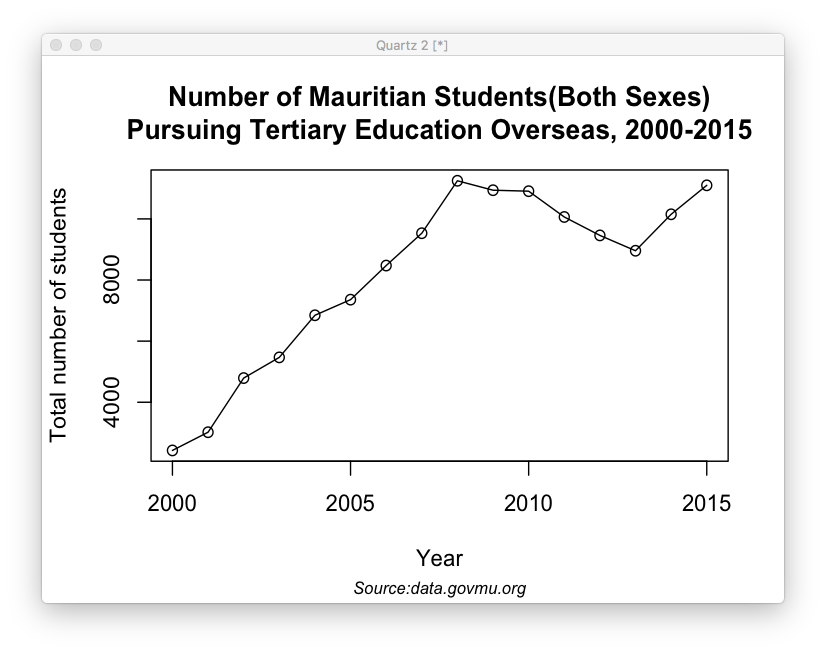
You can use the plot() function to draw charts. For the above resource, you can plot a line chart with “Year” as x-axis and “Total number of Students(both sex)” as y-axis.
#plot a line chart

plot(resource_data$Year,resource_data$Number.of.Mauritian.Students.Pursuing.Tertiary.Education..Overseas.Total, type = "o", xlab = "Year", ylab = "Total number of students")

#give the chart a title
title(main = "Number of Mauritian Students(Both Sexes)\nPursuing Tertiary Education Overseas, 2000-2015", sub="Source:data.govmu.org", cex.sub = 0.75, font.sub = 3)
Wrap up
Data from Open Data Mauritius portal can be loaded directly into R using the dkanr package. You can manipulate, visualise or analyse the data. The possibilities are endless.